QtiPlot: Powerful Data Analysis and Visualization Tool
QtiPlot is a sophisticated and user-friendly application designed for scientific data analysis and visualization. It combines the functionality of a spreadsheet with advanced features for statistical analysis, making it an essential tool for researchers, students, and professionals alike.
Key Features
- Intuitive Interface: QtiPlot offers a clean and straightforward user interface that facilitates data input and manipulation, allowing users to focus on analysis rather than navigation.
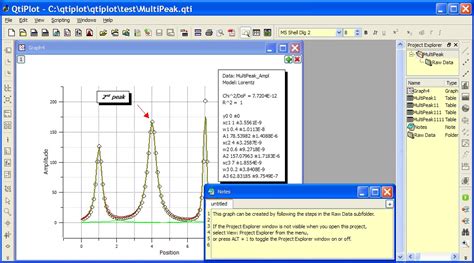
- Data Visualization: Create high-quality graphs and plots with ease. QtiPlot supports a variety of graph types, including 2D and 3D plots, contour plots, and statistical charts.
- Extensive Statistical Functions: Utilize a comprehensive set of statistical tools for performing complex analyses, such as regression, ANOVA, and curve fitting.
- File Compatibility: Import and export data in multiple formats, including ASCII, Excel, and Origin files, ensuring seamless integration with other software.
- Custom Scripting: Enhance functionality through built-in scripting capabilities with Python and C++, allowing users to automate tasks and extend features as needed.
- Multi-Language Support: QtiPlot is available in several languages, making it accessible to a global audience of users.
Whether you’re conducting experiments, analyzing data sets, or presenting findings, QtiPlot stands out as a robust solution for all your data-driven needs. Download it for free today and unleash the potential of your research.
Leave a Reply